The case against map visualisations

One of the most abused forms of data visualisation in information security today is the world map. During this post, I’ll explain how making maps our “go to” visualisation limits the insights we can show.
But it’s a natural fit…
Certainly, maps seem like a natural choice for network data. You have a log file containing thousands of IP addresses. You’d like to understand what’s in there better. You geo-locate the IP addresses into country codes then plot it using Google Maps. The data is now visual - visualisation complete!
Or perhaps not.
Visualising your data to increase understanding is a great idea, but I’m going to convince you that a map is often not the best way. I’m going to assume that you want to build a visualisation to gain operational insight, not something that’s flashy but ultimately meaningless (aka “management porn”).
Why not maps?
In the non-Internet, meatspace world, distance matters. The time it takes to travel between two points depends on distance and geography. Outbreaks of disease depend on geography. Which languages are spoken somewhere depend on geography (among other things). The spread of fires, cyclones, and floods all depend on geography too. A map is the perfect choice for any of these, because the primary relationship a map displays is distance and geography.
On the Internet, however, distance is not a factor we’re usually interested in. Every endpoint is only a few routing hops away from every other point. For the purposes of time and reachability, nodes may as well be right next door. Every point is next to every other point. Physical distance means almost nothing.
Once a PC is infected with a new worm, what factors impact its spread? Operating system. Patch level. The presence of network filtering. In many cases, it’s not geographical location. Even if it is related to geography, I’ll show you why we have better options.
But everyone knows what a map is!
Everyone is familiar with maps, but that doesn’t always make them the most effective choice. The goal of a visualisation is to tell a story, or explain a point. How does a map tell your story?
Before you think about that, think about this. Using a map, we burden ourselves with all sorts of unnecessary constraints.
Map constraints
1. Comparisons are difficult to make on a map
Let’s say that you have a worldwide malware infection. You put the data on a map, and it looks like this:
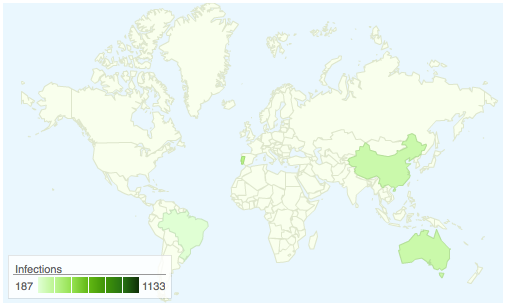
Some questions: * How many countries have infected computers? * Which country has the most infections? * What are the top three infected countries? * How many more infections does China have than Brazil?
Pencils down. Okay, let’s try this another way. Plotting the same data again on a stacked line chart looks like this:
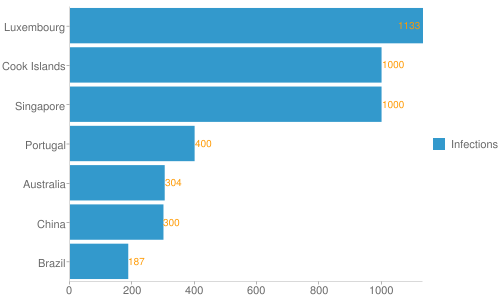
How did your observations compare? On a regular graph, these relationships are far more obvious.
Even though Australia has far fewer infections than Luxembourg, Australia captures much more attention on the map because of its large land mass. Here, we’re giving countries with large land map a disproportionate weighting, when land mass generally has little to do with computer security incidents.
2. Wasted space
If:
a) 78% of the earth’s surface is water; and
b) a very small percentage of computer security incidents occur in the ocean; then
c) we have wasted a large proportion of our visualisation on areas we can’t put data on, other than labels and legends.
When we make a visualisation, a major challenge is fitting everything we want to show in the screen real estate available. Screen real estate is one of the most precious resources we have. Working within the rigidity of a map makes our job that much harder.
3. One relation is already constrained
Visualisations compare different factors looking for trends and relationships. For example, a simple line graph might show time versus infections.
If we use a map, one of those factors, geography, has already been chosen for us. We then have to shoe-horn our data into a map, doing all sorts of workarounds like animations or clicking on data points to display the relationship that’s really important.
But my data IS related to country!
Perhaps the country of origin IS important. For example, you want to demonstrate that a politically-motivated DDoS is originating from a single country.
However, the same problems exist. What if the attacks are coming from a tiny country to a larger country? What if there are multiple attacking countries? How do I work out who is contributing the most traffic to the attack?
If the story you want to tell is “Attacks are primarily coming from countries X, Y and Z”, you have lots of simple options. You could use a directed graph, a bar chart, or a treemap for a start. These options will also give you a lot more freedom to incorporate other data. For example, a stacked bar chart will let you break each country’s data into operating system.
No, really, geography is important to my analysis!
Some information security problems really do depend on geography, and these are appropriate to put on a map. For example, a backbone cable cut affects a geographic region. Knowing where the cable cut occurred (e.g. in the Persian Gulf) might give clues to the cause, and to which places were affected.
A rarer case might be something like the spread of a worm via Bluetooth. In this case, a short range technology is used for propagation, so physical distance is an issue. We can track the spread of the Bluetooth worm much like a biological virus. A map helps us predict where it will spread next.
Lobby displays
One area where map-based visualisations dominate is in flashy “defcon” style maps. A flat screen showing a spinning globe with glowing packets racing from one city to another is undeniably attractive - just don’t expect to learn anything. If your goal is to impress VIPs or make a nice backdrop for a television interview, maybe you in fact want to invest in a flashy map display.
Conclusion
Maps are highly overused in information security visualisations. Most of the relationships we want to show in information relating to networks aren’t geographical.
Far better options like the humble bar graph exist that provide more operational insight and demonstrate the point you’d like to make better. Save your maps for that LCD kiosk in your lobby, or problems that are actually affected by geography.
Chris (@Parsify)
CSIRT Foundry specialises in custom data visualisations for information security and network data. Contact us to find out more.